Zimmer and Peacock used our technology stack 'SeeItAll' to monitor a cell culture/bioreactor of E. Coli as it went through it's growth cycle.
This application note describes how to gather fermentation curves during cell growth using Zimmer & Peacock electrochemical biosensors. This particular example describes pH and glucose determination during Escherichia coli (E. coli) incubation. However, the methodology is generic and may be applied with different cell cultures and analytes, with little to no modification.
The expression of certain analytes is indicative of cell count and reaction processes. Areas of application involve monitoring of bioreactors, studying new cells or well-known cell cultures under new conditions, or even controlling parameters in beer or wine production. E. coli is a species of bacterium that resides in human’s and animal’s large intestine and is integral to the digestion process. It is arguably the most studied bacterium, in part due to it being easy to work with. E. coli prefers sugars for nutrition, and thus the glucose concentration in a growth medium will change as a function of cell count. By-products generated in the fermentation process include acids, and as a result, the growth medium undergoes an acidic change in pH. Under optimal conditions, the growth rate follows an exponential trend, but tapers off as the biological system becomes limiting, either due to nutrient depletion or the by-product build-up becomes too toxic for further growth. Therefore, the growth curve (cell count vs. time) takes on a sigmoidal shape, as illustrated in Figure 1. A low glucose concentration compared to the initial value, or a plateauing pH is indicative of the culture having reached the growth limit.
cost.
The measurements of such parameters has historically not been a trivial exercise, due to the cost, complexity and maintenance associated with the state-of-the-art measurement systems. The implementation of low-cost disposable and reusable electrochemical biosensors is a game changer in that enables unskilled operators to gather high accuracy data at a low
The E. coli strain used in this experiment, strain K12, is not regarded as harmful (biosafety level 1 of 4). However, measures should be taken to avoid spreading the bacteria.
It is also important to avoid contamination of the E. coli culture; we wish to ensure that the K12 is the only microorganism we grow. Hence working bench and equipment is wiped with 70 % ethanol, and sterile technique is used when working with the bacteria. This is to avoid other microorganisms from affecting the experimental results. Gloves are used to protect both the bacterial culture from our hands, as well as to protect our skin. The culture flasks and stoppers are run through a flame when opened and closed to avoid airborne contamination.

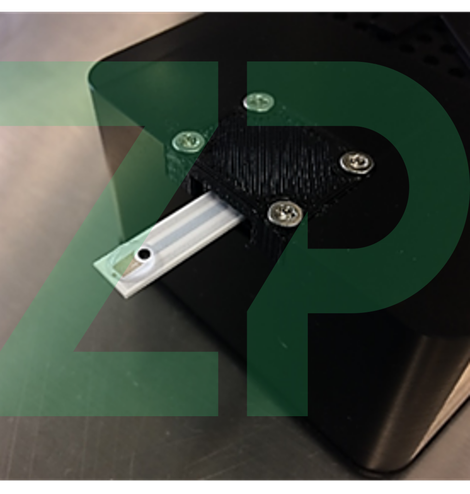
Set the incubator to 37 ℃ and 120 RPM. Load 100 mL of growth medium in a 250 mL Erlenmeyer flask. Extract 1 mL into a separate clean container. We will use this to gather our blank readings (C(t = 0)), i.e. the reference values of pH and glucose before inoculation to us for comparison at later times (C(t > 0)). Insert a glucose sensor into the electrochemical workstation. Load 40 µL of sample onto the sensor, as illustrated in Figure 3, and perform chronoamperometry with the following settings: E = 0.65 V, t = 200 s, sampling interval: 0.1 s, current range up to 10 µA. Store the obtained curve. Remove the sensor from the reader using tweezers to avoid contact with the sample. Knock the sample into a designated waste jar, and rinse the sensor with running de-ionized water for at least 10 seconds. Dry off the sensor by gently touching a piece of paper to the excess solution to wick the remains up into the paper. Store the glucose sensor in a fridge between measurements to limit the degradation of the enzyme. Place the pH sensor in the reader, load 40 µL of sample onto the sensor and run open-circuit potentiometry (OCP) with the following settings: t= 200s, sampling rate 0.1 s. Store the data, rinse as described above and store the sensor at room temperature between readings.
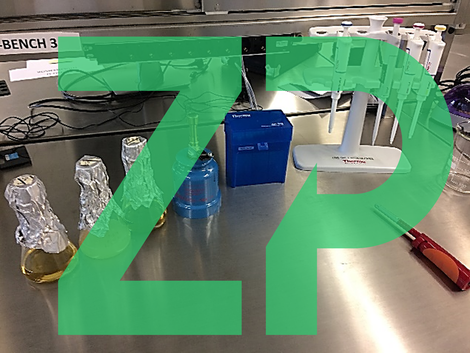
All measurements were made on the SeeItAll platform.
Inoculate a fresh broth solution (100 mL) with 1 mL of bacteria and load them into the incubator. You can also insert a an uninoculated flask for comparison. When one hour has passed, the difference between inoculated and blank will be visible by the former having become cloudy from the E.coli. Extract 1 mL of the inoculated sample and perform the measurements described in the previous section. Note that the sensor now is contaminated with E. coli and should be stored in a container to avoid contaminating the workspace. Continue with hourly extractions and measurements until the signals plateau. Under optimal conditions, E. coli fully matures within four hours.
DATA ANALYSIS
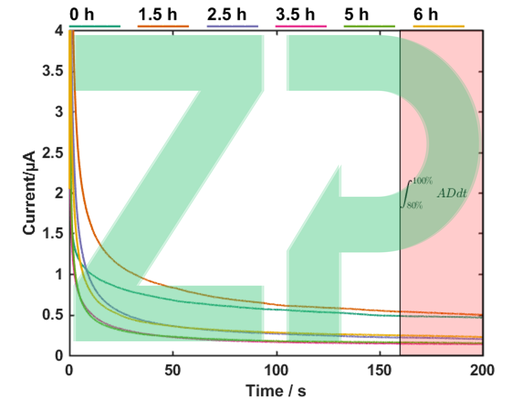
The sensors can be calibrated either with preset linear calibration coefficients shipped with the sensor, or deduced from the obtained data. To obtain the fermentation curves, integrate the last 20 seconds of each signal, S, and treat it as follows:
Ct=c1×S+c0
where Ct corresponds to the calibrated concentration at some time t (hours), and c1 and c0 the reciprocal sensitivity and offset. To obtain these from the session data, simply make note of S(t = 0) and S(t = 5 hrs) and solve using the boundary condition of the known analyte concentrations at these times.
The raw data as well as the fermentation curves are plotted adjacently for glucose and pH, respectively. The glucose level follows an inverse sigmoidal trend as the increasing cell population consume it at a proportionally increasing rate. The pH shows a gradual acidification of the medium as the bi-products build up.
GLUCOSE DATA

pH DATA


