There is a commercially and technically important fact that is not widely known, which is ..'if you can analyse a molecule by UV-Vis, Fluorescence Spectroscopy, Colorimetric assay, Surface Plasma Resonance etc then you can probably detect it by electrochemistry as well'..
Why use electrochemistry?
If you are looking for a super low cost and robust detection/analysis/sensing technology, then electrochemistry is probably the best platform for you. Most home use glucose strips on the market are electrochemical and this is because the developers and manufacturers realised that they could make the electrochemical test strips at super low cost, that the electronics were low cost and that the sample, blood, could be analysed without any preparation, purification dilution etc.
The issue with electrochemistry
The issue with electrochemistry is that scientist are often taught optical methods as undergraduates and so the techniques are very familiar to us, but electrochemistry and electroanalytical techniques are not so widely taught. At ZP we see our role in part to give people the tools and training to get started on using electrochemical techniques.

How to get going?
In this quick tutorial we are assuming that you have some electrodes and a potentiostat sourced from Zimmer and Peacock, if not hopefully the notes are useful.
We seven seven steps in getting your first electrochemical data on the molecule of interest for you.
1st – I would connect a sensor to the Ana Pot and start the software. Once the connection is established, you should apply the settings according to the attached picture.
2nd – I would then pipette a blank solution (e.g. PBS) on the electrodes’ area, about 30 – 40 uL covering all electrodes.
3rd – I would the run a CV scan with the settings in step 1 and save the data. This would be the baseline.
4th – I would then replace the sensor and pipette a known concentration of molecule (e.g. 10 mg/dL) in solvent (e.g.phosphate buffer solution) on the electrodes’ area, 30 – 40 uL.
5th – Run the CV scan and save the data.
6th – You can then compare both CV scans and check for oxidation, or reduction, current peaks that do not appear on your baseline (e.g. only phosphate buffer solution). These will correspond to the presence of your molecule
7th – You can then test different concentrations of your molecule to see if the peak current detected is proportional to the concentration. If everything goes well, the higher the peak current, the higher is the furosemide concentration.
For a ZP Platinum sensor start with these settings.

For a ZP Carbon and Gold sensor start with these settings.


Initial Data
A client followed this exact advise and their initial data is shown in the adjacent image. it was clear that there was a large difference between the baseline signal and the sample with the compound of interest added.
Next Steps
The initial data above showed that at about approximately 50 mV there was a peak, and above 200 mV there was nothing interesting so the ZP Senior Scientist advised the client to do a second series of experiments, but where the upper voltage was limited to 600 mV and the compound of interest was varied so that we could see whether the peak of interest increased as a function of concentration.
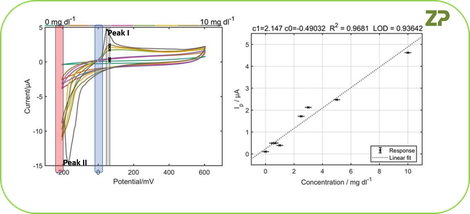
Further data
Our client did as requested and varied the concentration between 0 and 10 mg/dL, by analysing the peak at 50 mV we could see that the peak height is proportional to the concentration of compound of interest; therefore we can conclude that we are able to detect the molecule of interest.
A quick assessment of the data showed that the limit of detection (LoD) for this compound was approximately 1 mg/dL, for some applications this LoD is fine, but for other applications we may need to develop the assay sensitivity further.
Zimmer and Peacock is super friendly company so feel free to contact us with any technical questions.